Network Monitoring.
Everything, One Pane.
Watch switches, servers, services, databases and cloud endpoints from a single collector — up/down, latency & packet-loss, SNMP interface health, TLS expiry, and agent-fed host metrics. Fully cloud-hosted, with PRTG-style sensors billed monthly. No credit card required for the trial.
See MantisNMS end to end.
A narrated walkthrough of the network overview, live map, config backup, NetFlow, syslog and the sensor dashboard, recorded on a live demo tenant.
See everything
on your network.
PRTG-style monitoring across 50+ sensor types, NetFlow traffic analytics, network config backup & change management, and agent-fed host metrics — from a single collector, priced per sensor and billed monthly with no annual contract.
50+ Sensor Types
Ping (with loss & jitter), TCP/HTTP/TLS, DNS, SNMP interface & host health, SSH/FTP/NTP/LDAP/RDP, SQL Server / Oracle / MySQL / PostgreSQL, Redis, MongoDB, Redfish, VMware vCenter & Hyper-V.
Traffic Flow Analytics
NetFlow v5/v9, IPFIX, and sFlow. See top talkers, conversations, and applications per exporter — exactly which hosts and apps are using your bandwidth.
Agentless Collector
One lightweight probe monitors an entire site — no per-device agent. Or install the unified agent for CPU/mem/disk/IO/network plus service, process & event-log rules straight from servers.
Smart Alerting
Threshold & syslog/trap content rules, acknowledgement, dependency-aware suppression, and notifications by email, Slack, Teams, or webhook — plus run a remediation script on the probe when a rule fires.
Discovery & Maps
Auto-discovery, a live topology map of every site built from LLDP/CDP and switch tables, traceroute with a geo view, and per-interface throughput & error graphs — organize sensors into logical groups per site or company.
Config Backup & Change Mgmt
Automatic scheduled (or on-demand) backups of switch, router & firewall configs over SSH — Cisco, Juniper, Fortinet, Arista, HPE/Aruba, MikroTik, Palo Alto — plus cloud-managed Cisco Meraki via the Dashboard API. Full version history with side-by-side diffs, drift alerts, and a security compliance check (default SNMP community, telnet, plaintext passwords, missing hardening) with your own custom rules.
Credential Vault
Store service credentials once, encrypted at rest, and reuse them across VMware, Redfish, and SSH-command sensors — secrets never leave your tenant.
History & Reports
A Network overview that groups related alerts into incidents with their root cause, long-term metric history tiered to your own storage, availability reports, and dashboards with per-site/company status widgets and top-port utilization.
Cloud-Hosted, Billed Monthly
Fully cloud-hosted — no Windows server to run and patch — and billed monthly with no annual contract, on one platform with Mantis360 & MantisRMM (bundle all three for 10% off). Comparable per-sensor pricing, about 4–12% below PRTG's list prices (as of October 2026): from $175/mo for 500 sensors.
Network visibility,
end to end.
From the Network overview to live topology maps, here's MantisNMS keeping watch over every device on the network.
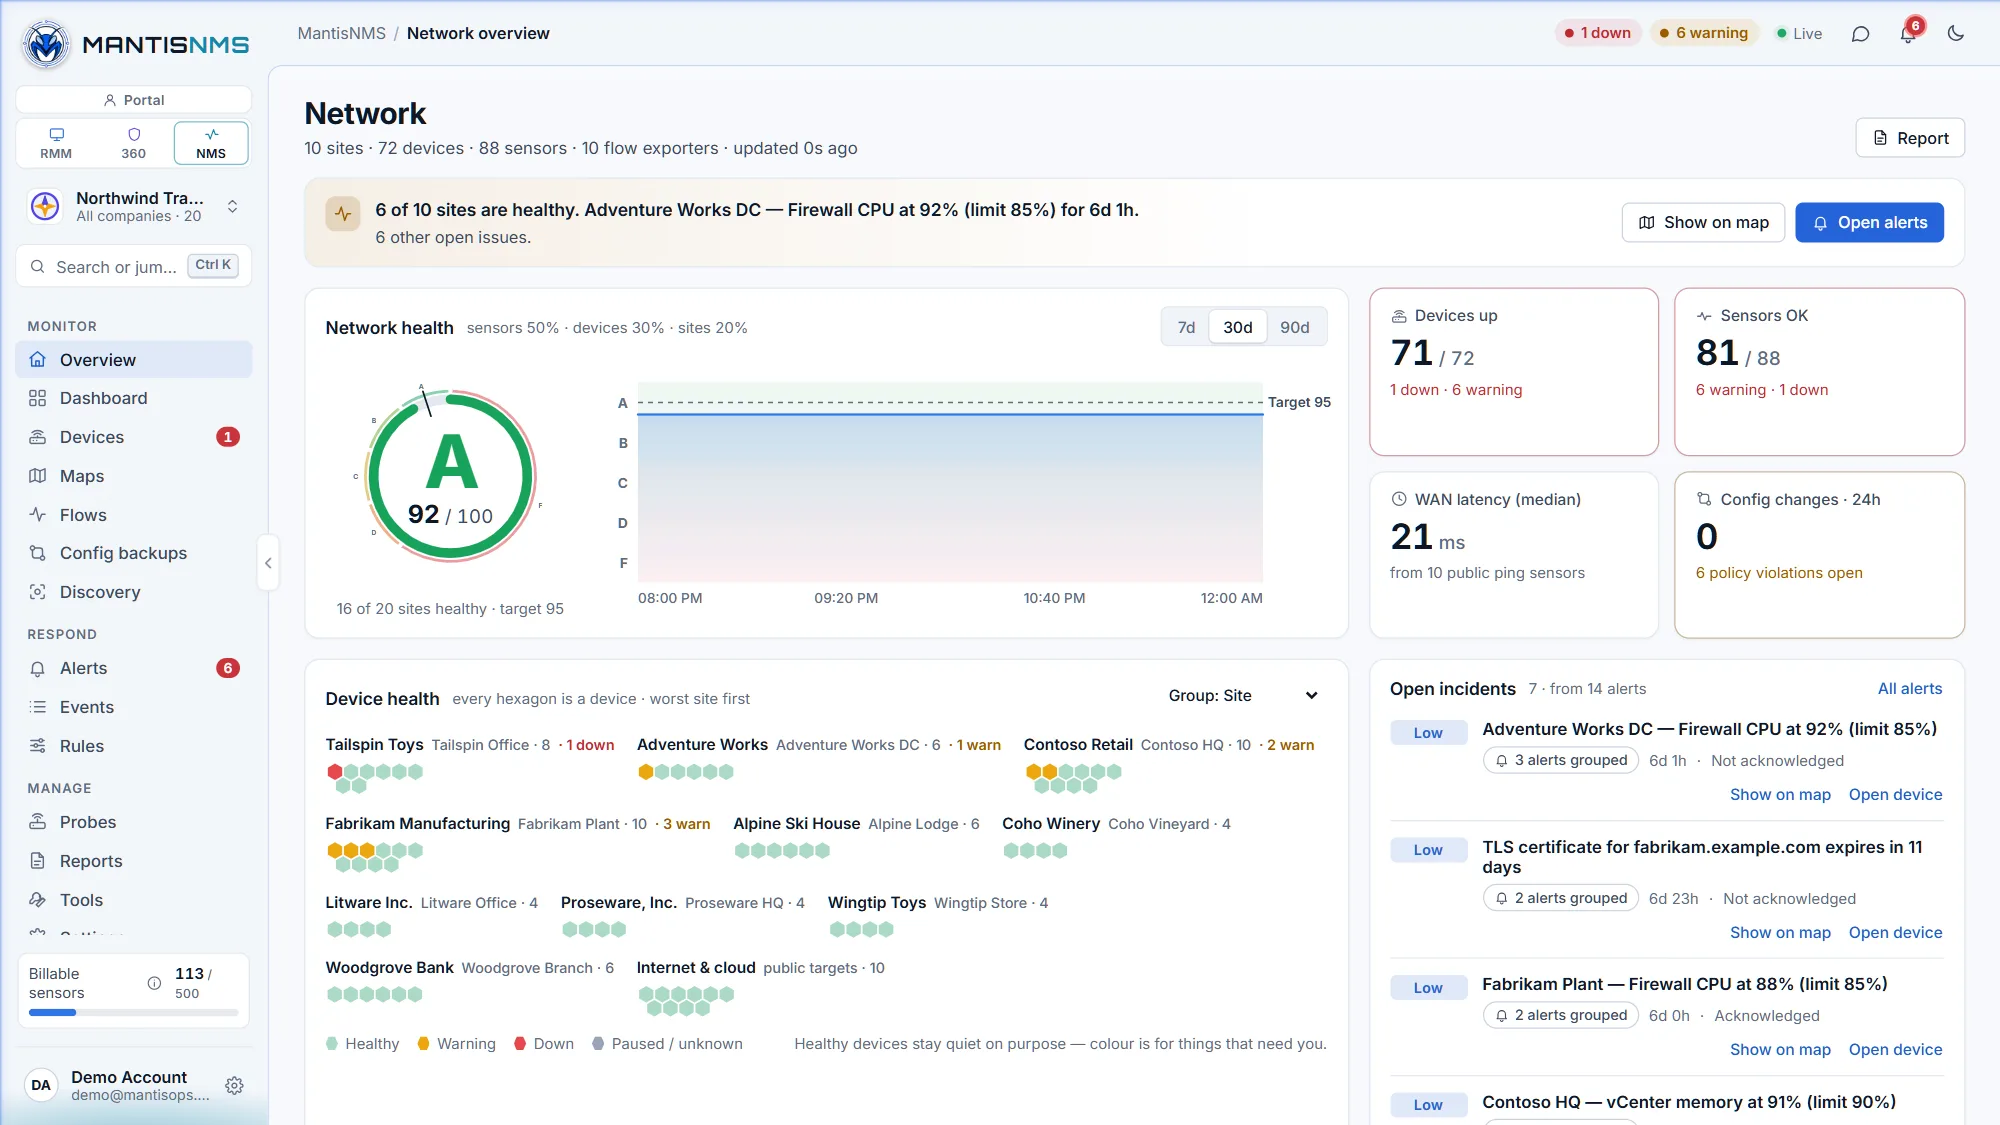
The whole network in one sentence
A device-health honeycomb for every site, KPI tiles, and open incidents grouped with their probable root cause — quiet when everything is healthy.
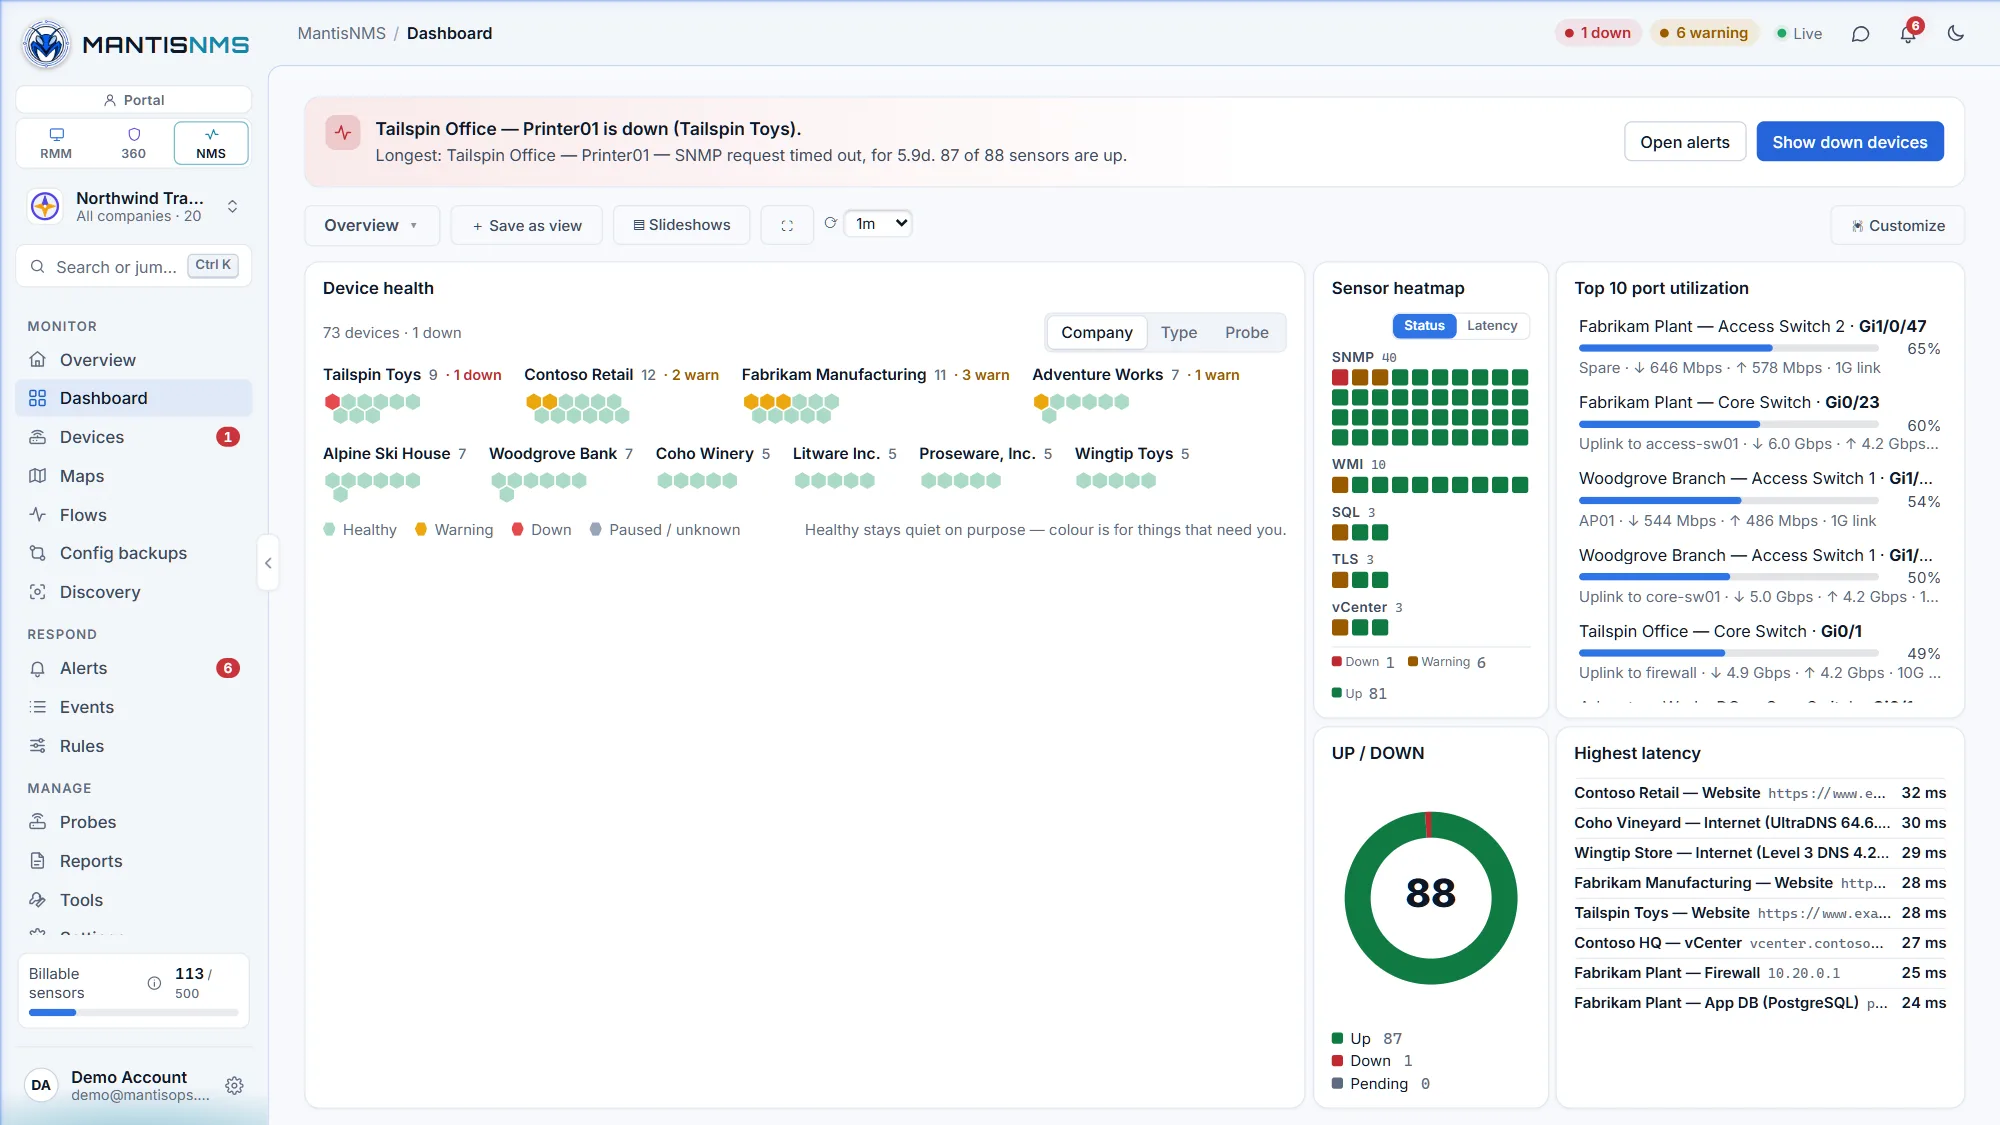
Every sensor, one screen
Device health by company, a sensor heatmap, the busiest interfaces, and the highest-latency targets — refreshed on a timer.
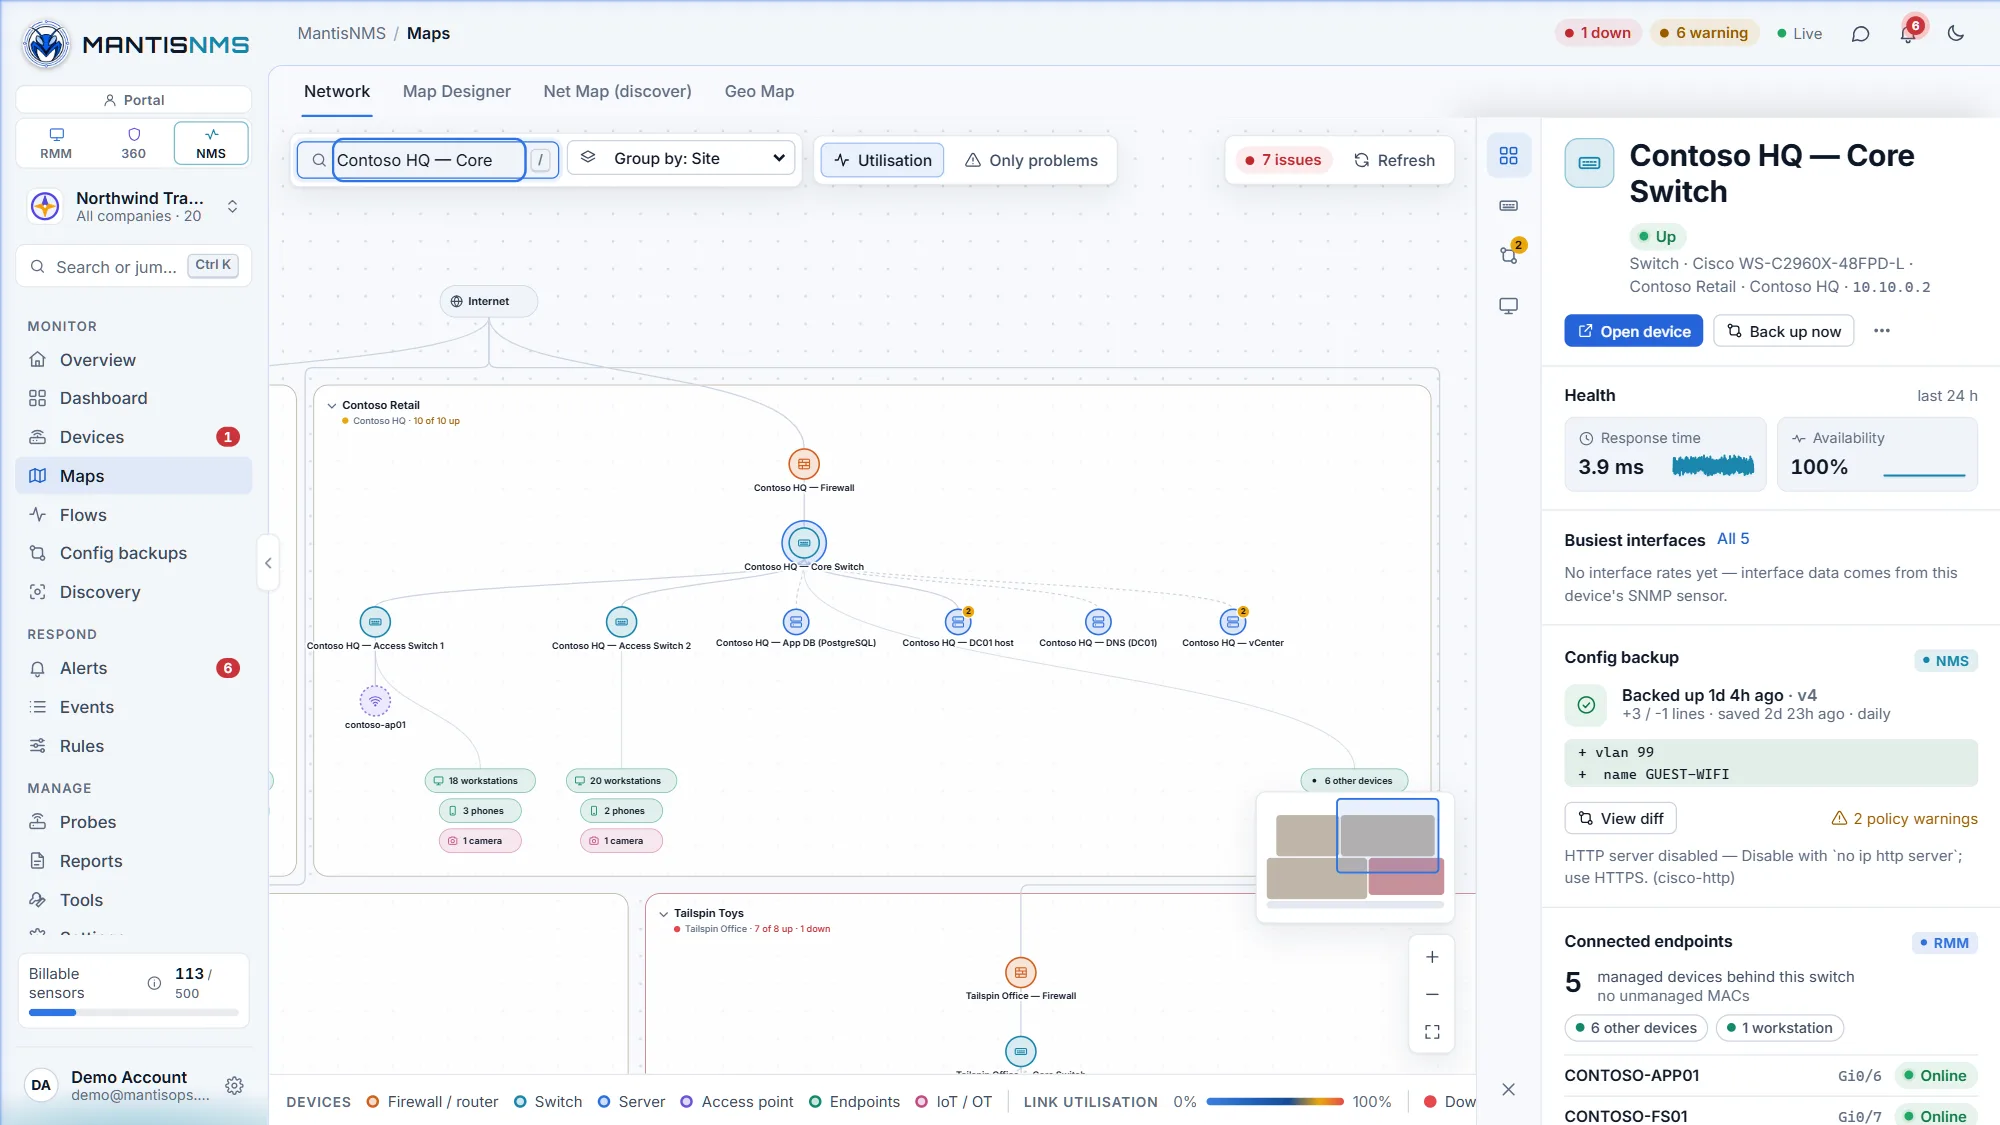
Live network maps
Topology discovered from LLDP and CDP — from the Internet edge through firewalls and switches to every endpoint, with live link utilisation and a side panel for any device.
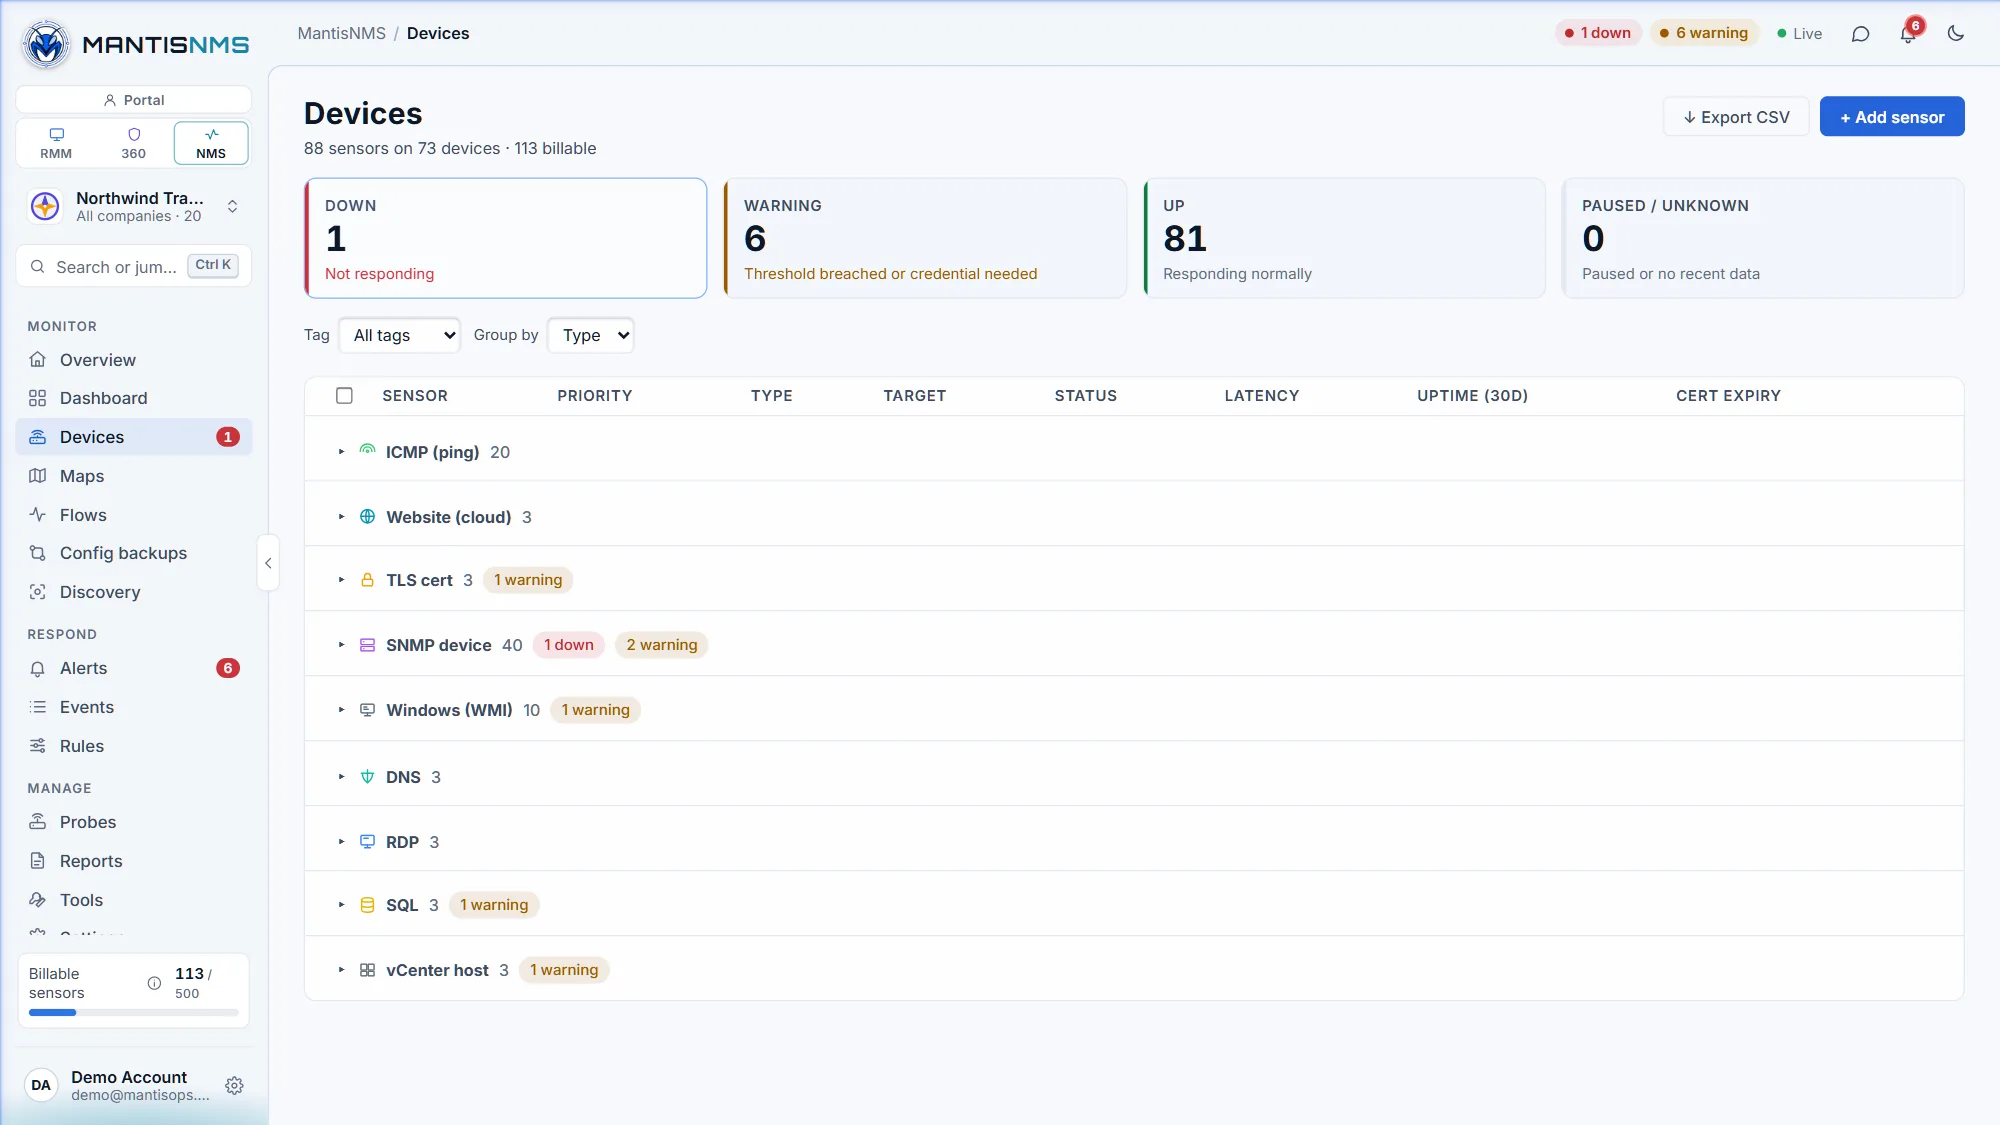
50+ sensor types, PRTG-style
ICMP, SNMP, web, TLS, DNS, SQL, vCenter and RDP sensors grouped by type — with state, latency, and uptime at a glance.
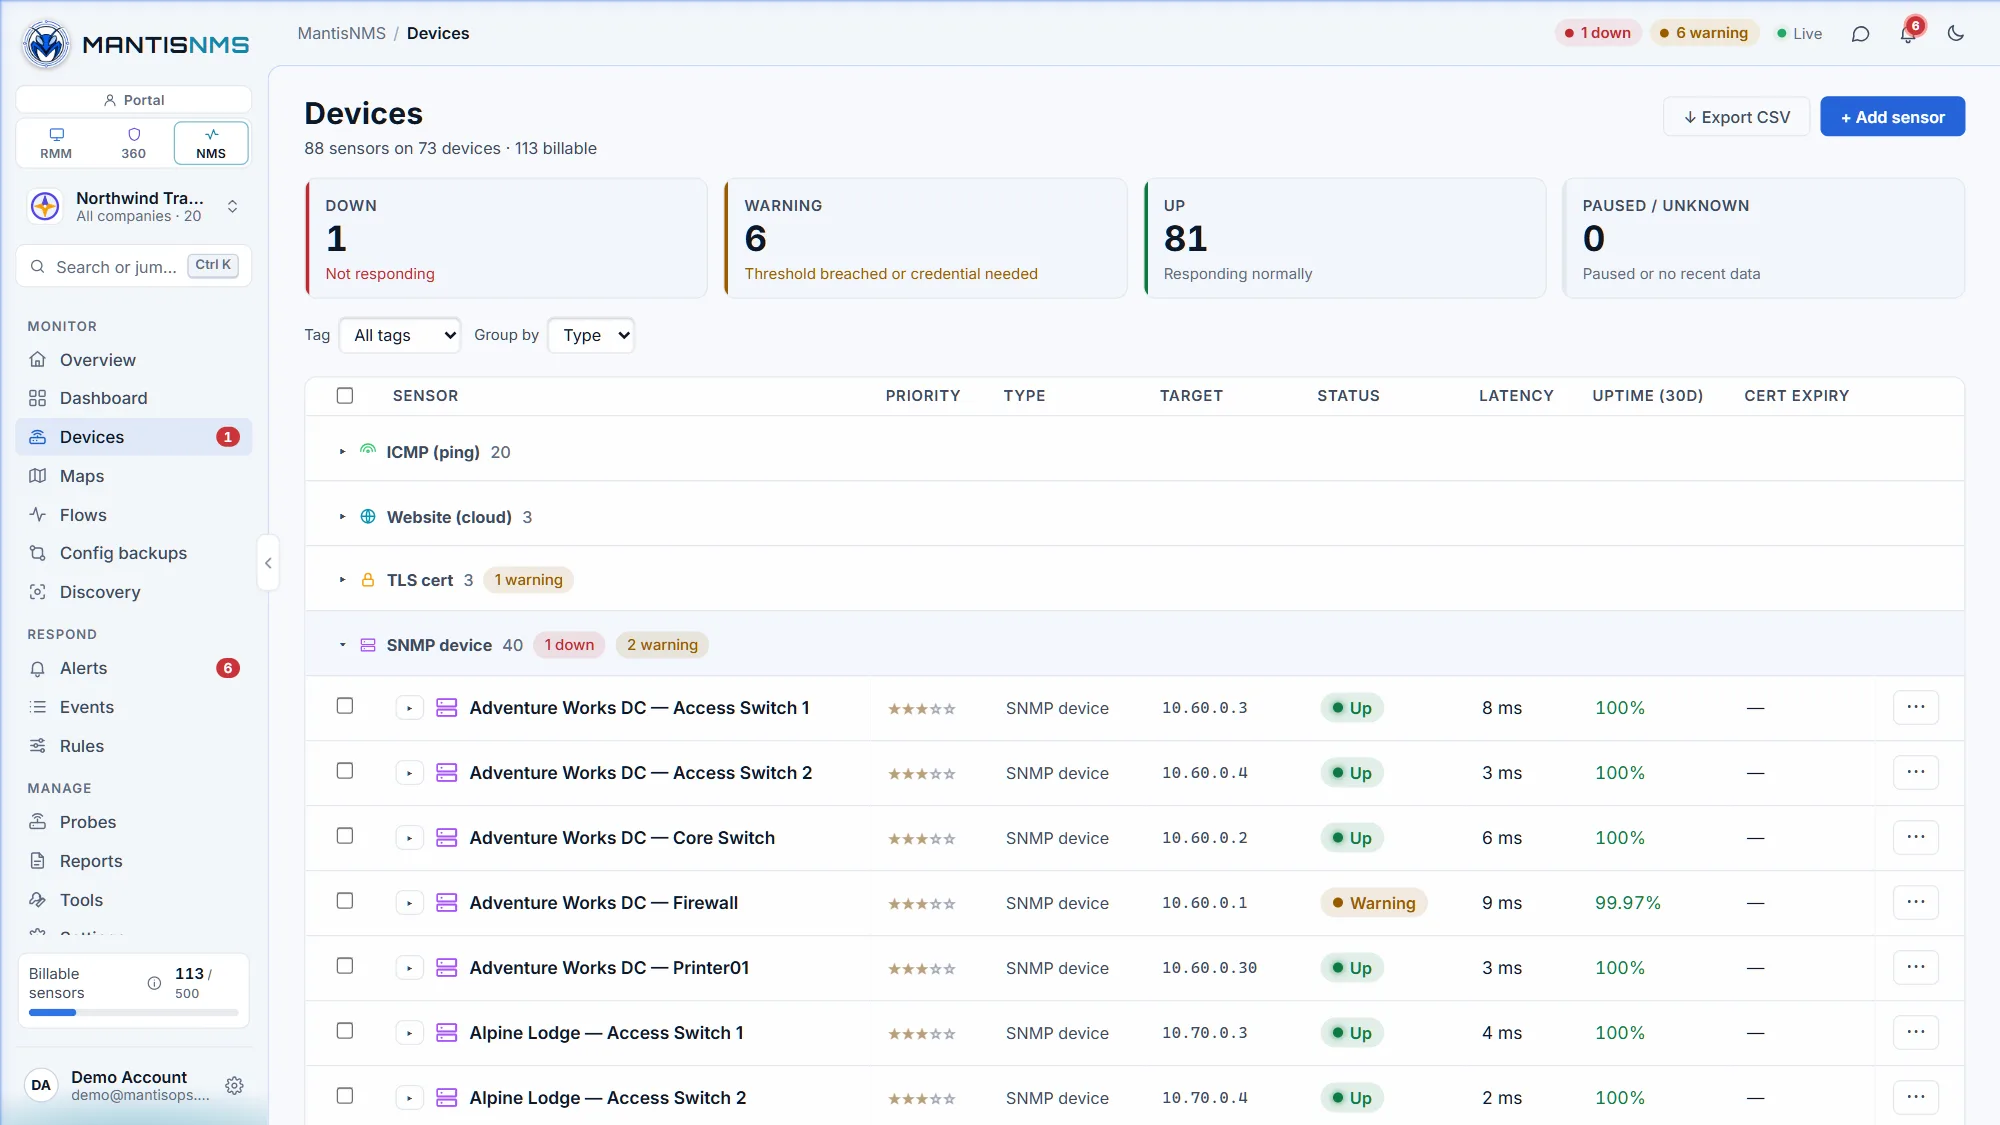
Every device, every check
Expand any sensor type to see each device's target, state, latency and uptime — then add, pause or edit sensors from the row menu.
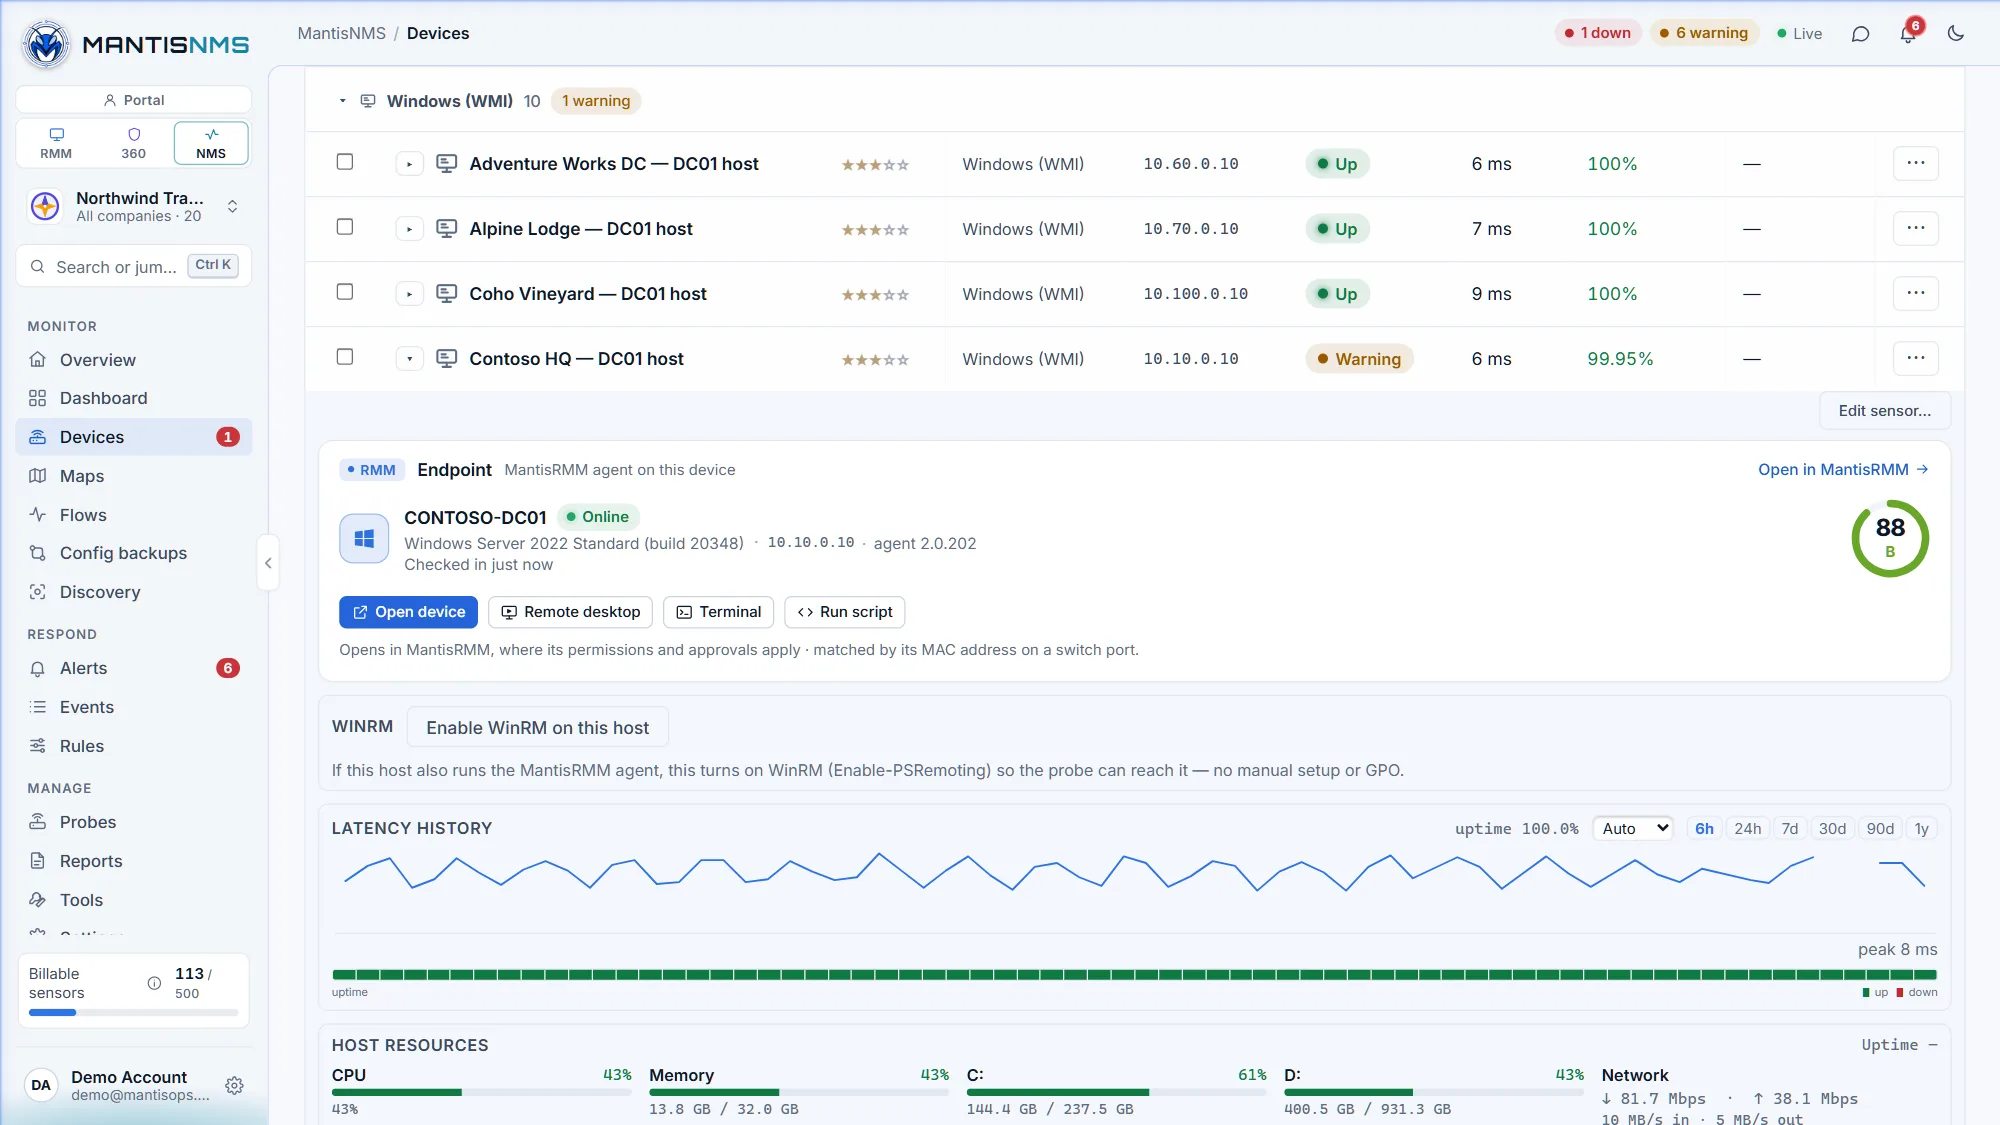
The endpoint behind the sensor
A host sensor shows the MantisRMM agent on that machine — status, OS, agent version and health score — with Remote desktop, Terminal and Run script one click away.
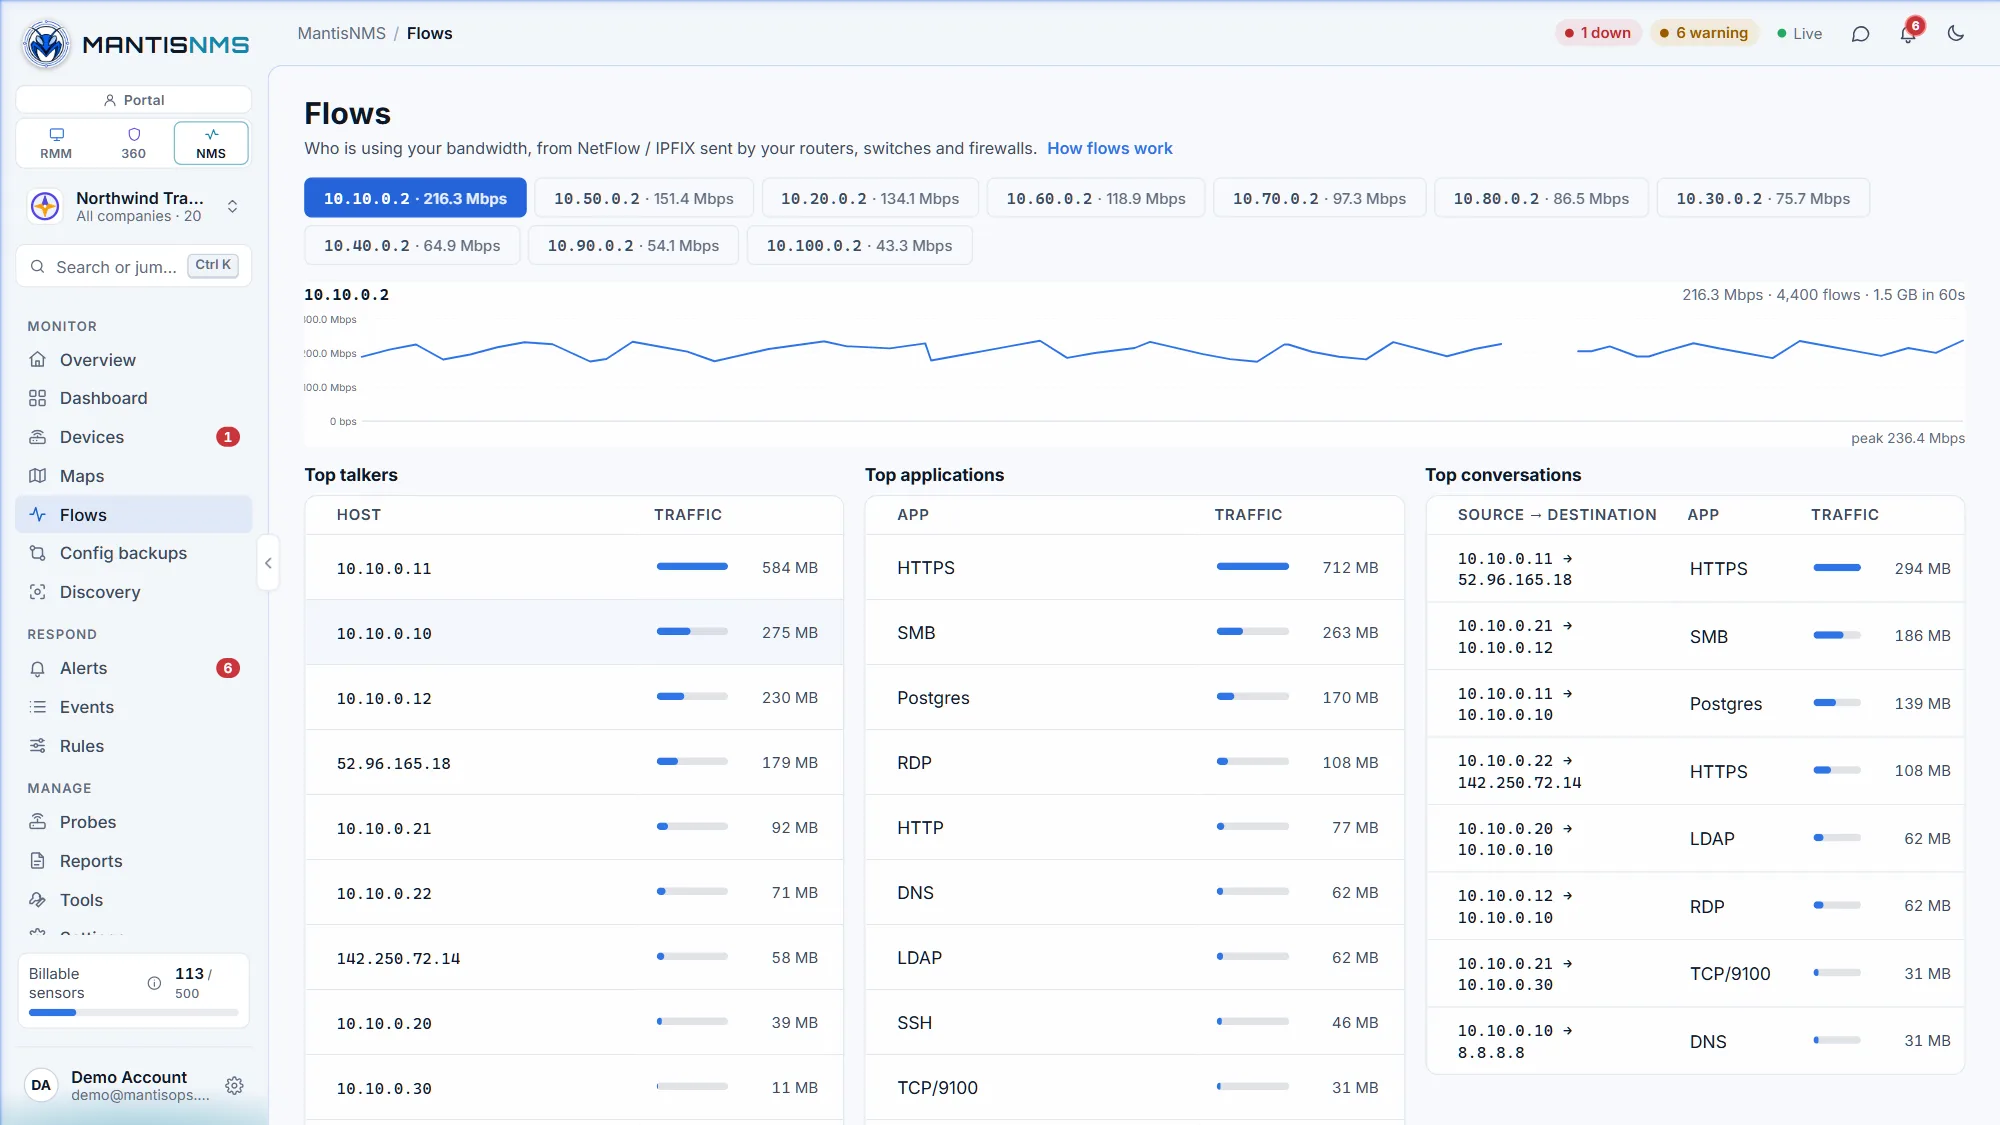
Who's using the bandwidth
NetFlow, IPFIX and sFlow turned into top talkers, conversations, and applications for every exporter.
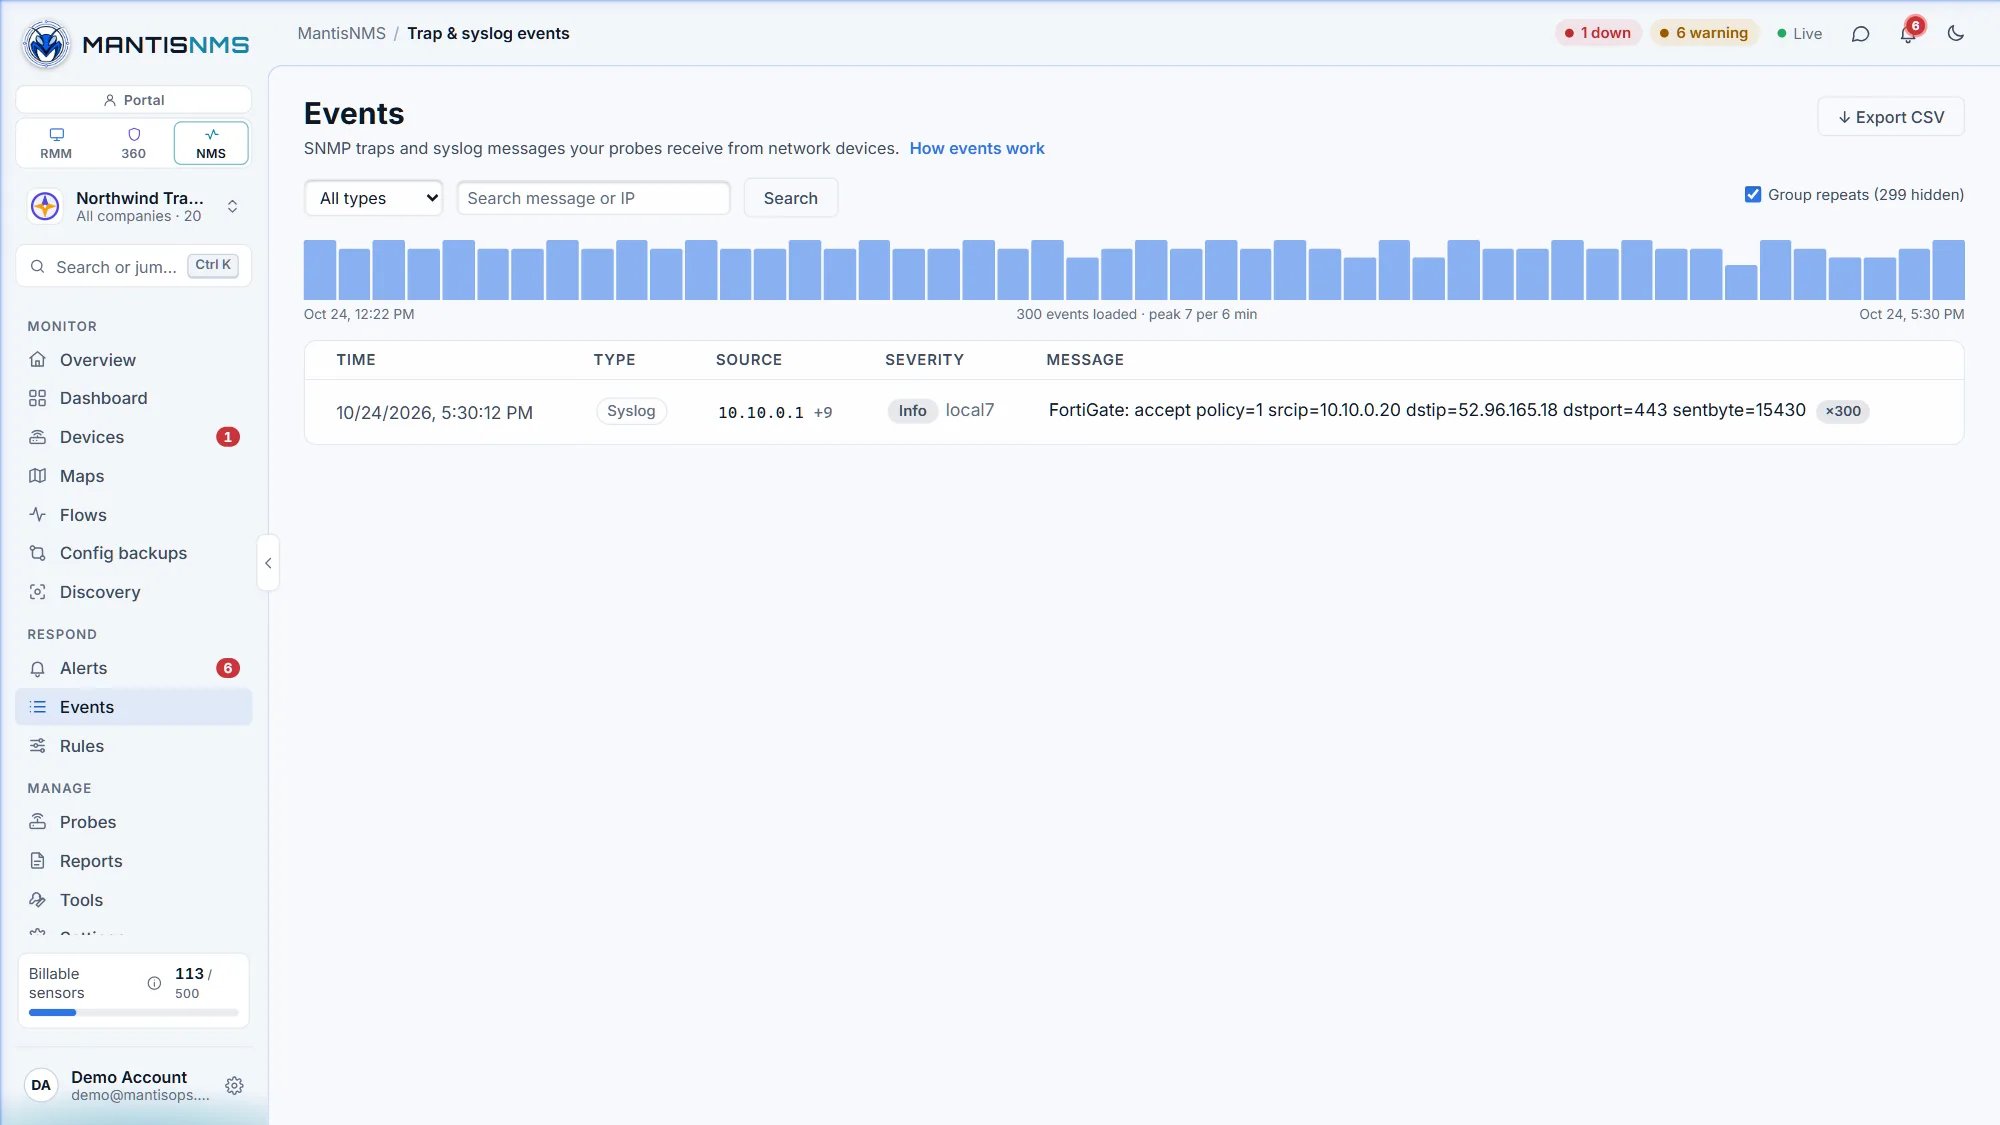
Syslog and traps, searchable
Firewall IPS blocks, link flaps, config changes, and failed logons from every device — in one searchable stream with rules on top.
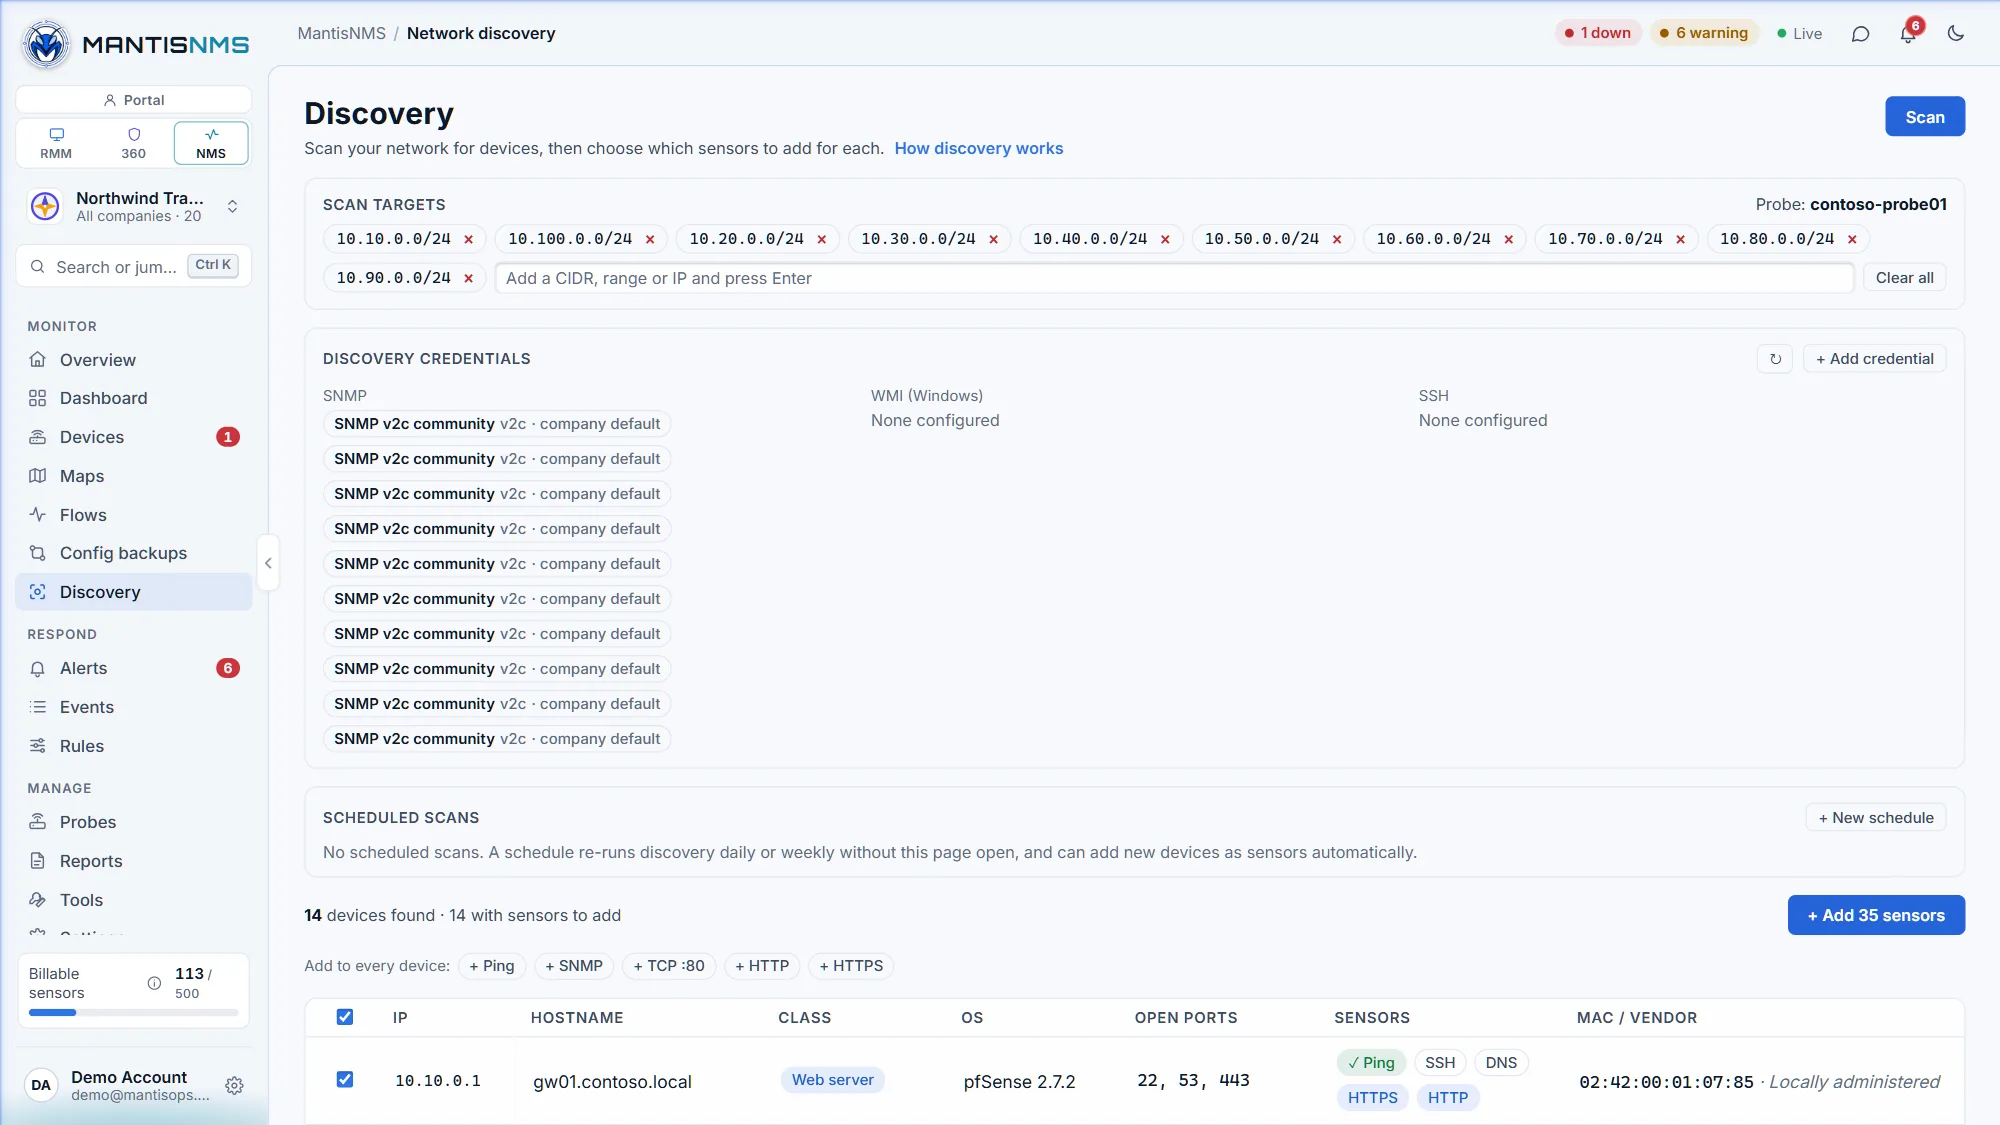
Discover what's on the network
Sweep a subnet from the probe and get every device with its vendor, OS, and services — then add sensors in one click.
Even better
as MantisOps Complete.
MantisRMM, Mantis360 and MantisNMS share one agent, one sign-in, one Customer Portal and one alerts inbox. Bundle all three for one invoice and 10% off.
The endpoint behind every sensor RMM
A sensor shows the RMM agent on that host — status, OS and health score — with one-click Remote desktop, Terminal and Run script.
Host monitoring from the agent
Start a MantisOps Complete trial and agents automatically run MantisNMS host monitoring — no separate install.
One alerts inbox
NMS incidents sit beside RMM alerts and Mantis360 findings in the Portal. Acknowledge there and it applies in MantisNMS.
Start Your Free Trial
No credit card required. We review every signup and email your activation link within one business day.
Start MantisNMS Trial →More: Network config backup · PRTG alternative
← Back to MantisOps